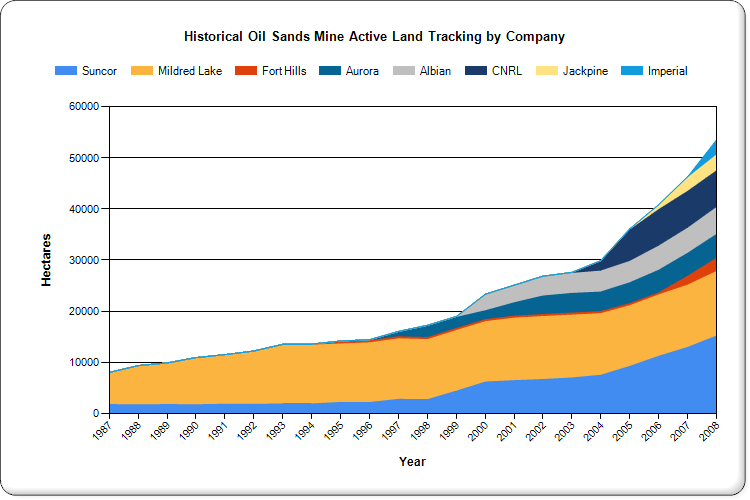
Historial Oil Sands Mine Active Land Tracking by Company 1987-2008.png
Preview
Additional Information
| Field | Value |
|---|---|
| Format | PNG |
| URL | https://osmdatacatalog-uat.alberta.ca/dataset/a6c27147-f12a-4b79-9246-63097ec021c2/resource/cab2e555-341b-4b02-8821-83a5c5edbe0a/download/historial-oil-sands-mine-active-land-tracking-by-company-1987-2008.png |
| Created | 4 November 2025 |
| Last Modified | 4 November 2025 |
| File Size | 23.48 KB |
| License | |
| Datastore active | False |
| Has views | True |
| Id | cab2e555-341b-4b02-8821-83a5c5edbe0a |
| Mimetype | image/png |
| Package id | a6c27147-f12a-4b79-9246-63097ec021c2 |
| Position | 0 |
| State | active |
| Tracking summary | {'total': 0, 'recent': 0} |
| Url type | upload |
About the Dataset
This graph indicates land actively used for oil sands mine operations from 1987 to 2008. By subtracting the amount of land reclaimed (including temporarily reclaimed land and land in various stages of permanent reclamation) from the total amount of land cleared of trees and disturbed, there is a better understanding of the amount of land actively used for oil sands mining operations.
Note that after 2008, this data set was replaced by the Regional Reclamation and Disturbance Tracking by Company data set, hosted in the OSIP data library (decommissioned Oct 2025). This data and accompanying graph were downloaded from the OSIP library in Oct 2025.
View full dataset: Historical Oil Sands Mine Active Land Tracking by Company, 1987 - 2008